This is a easy way to plot data in realtime or overtime using the wifi connection. Using the REST and some plotting javascript library, you can visualized the data quick and output to another other format, even a cloud base database for backup.
You can also gather data from many different sources via the same wifi network.
REST
$.ajax({
    url: 'http://192.168.1.178',   // device URL
     method: 'get',
     dataType: 'html',
     success: function(result){
     resultpkg = result.split(",");
     yVal = Math.floor(resultpkg[0]); //VOC
     yVal2 = Math.floor(resultpkg[1])/10; // CO2/10
     yVal3 = Math.floor(resultpkg[2]); // Temp
    },
    error: function(result){
    yVal=0;
     $("#t").text("error"); // write message on the html page
     }
});
Sensor
DEMO
How it works
The browser send out the GET request using Ajax via Jquery. In our case, it’s not really using the GETR request, it will return values no matter what.
Meaing that by enter the device URL like this one http://192.168.1.*** will show data sets like this one
30,23,31
The request is received via the Adafruit Feather M0 WiFi – ATSAMD21 + ATWINC1500, (Arduino Yun or anything can connect to WIFI and perform REST will work)
The Feather Wifi then ask for the sensor data and sent it back out the browser on the same network.
The number will look like this 20,23,2o. They are temp, voc, and CO2 in out case.
Back on the browser, it gets the data, and display it and plot the chart,.
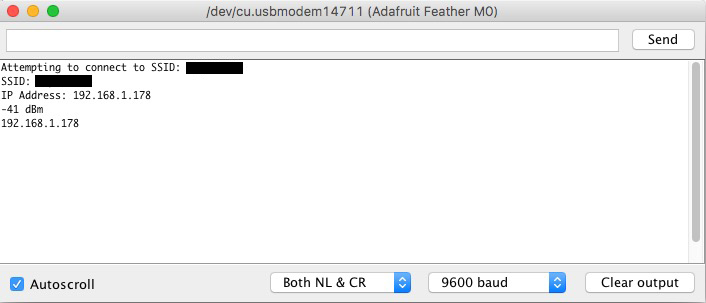
Arduino / Serial Monitor
You do not need to have Arduino Serial monitor running for this to work, this is to check if the device the connected to the network.
After you run the sketch using the downloaded sketch, you can use Arduino’s serial monitor to make sure the device is connect to your wifi and generate an IP address for you. You can have many different devices with different IP address on the same network, using the REST, you can even plot the 2 sets of data tougher using two devices wirelessly.
*
Make sure you edit the SSID and password area.
char ssid[] = “SSID”; // your network SSID (name)
char pass[] = “PASSWORD”; // your network password
About VOC Level
http://www.myhealthyhome.info/assets/pdfs/TB531rev2TVOCInterpretation.pdf

Downloads